-
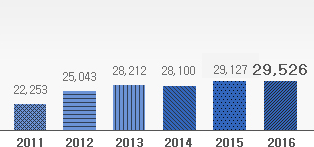
売上高(in KRW Billion)

-
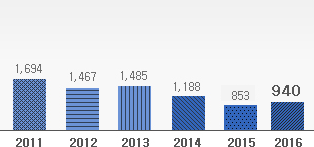
営業利益(in KRW Billion)

-
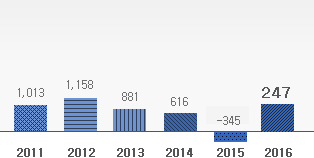
当期純利益(in KRW Billion)

-
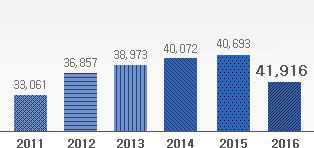
資産合計(in KRW Billion)

*2009년 : K-GAAP Non-Consolidated, 2010~2013년 : K-IFRS Consolidated
| Equation | 2015 (K-IFRS) |
2014 (K-IFRS) |
2013 (K-IFRS) |
2012 (K-IFRS) |
2011 (K-IFRS) |
|
|---|---|---|---|---|---|---|
| ROE | Net Profit / Equity | -2.2% | 3.50% | 5.20% | 7.60% | 7.20% |
| Debt ratio | Debt / Equity | 138.6% | 128.40% | 130.30% | 134.50% | 125.20% |
| Interest coverage ratio | OP / Interest Cost | 3.4x | 4.8x | 6.0x | 7.1x | 8.7x |
| Total equity ratio | Total Equity / Total Asset | 42.00% | 43.80% | 43.40% | 42.60% | 44.40% |
| ROA | Net Profit / Total Asset | -0.9% | 1.50% | 2.30% | 3.30% | 3.30% |
| Revenue growth | Current year / Previous year | 3.5% | -0.5% | 12.6% | 12.5% | 17.04% |
| Operating profit growth | Current year / Previous year | -27.8% | -20.0% | 1.2% | -13.4% | 6.0% |


